

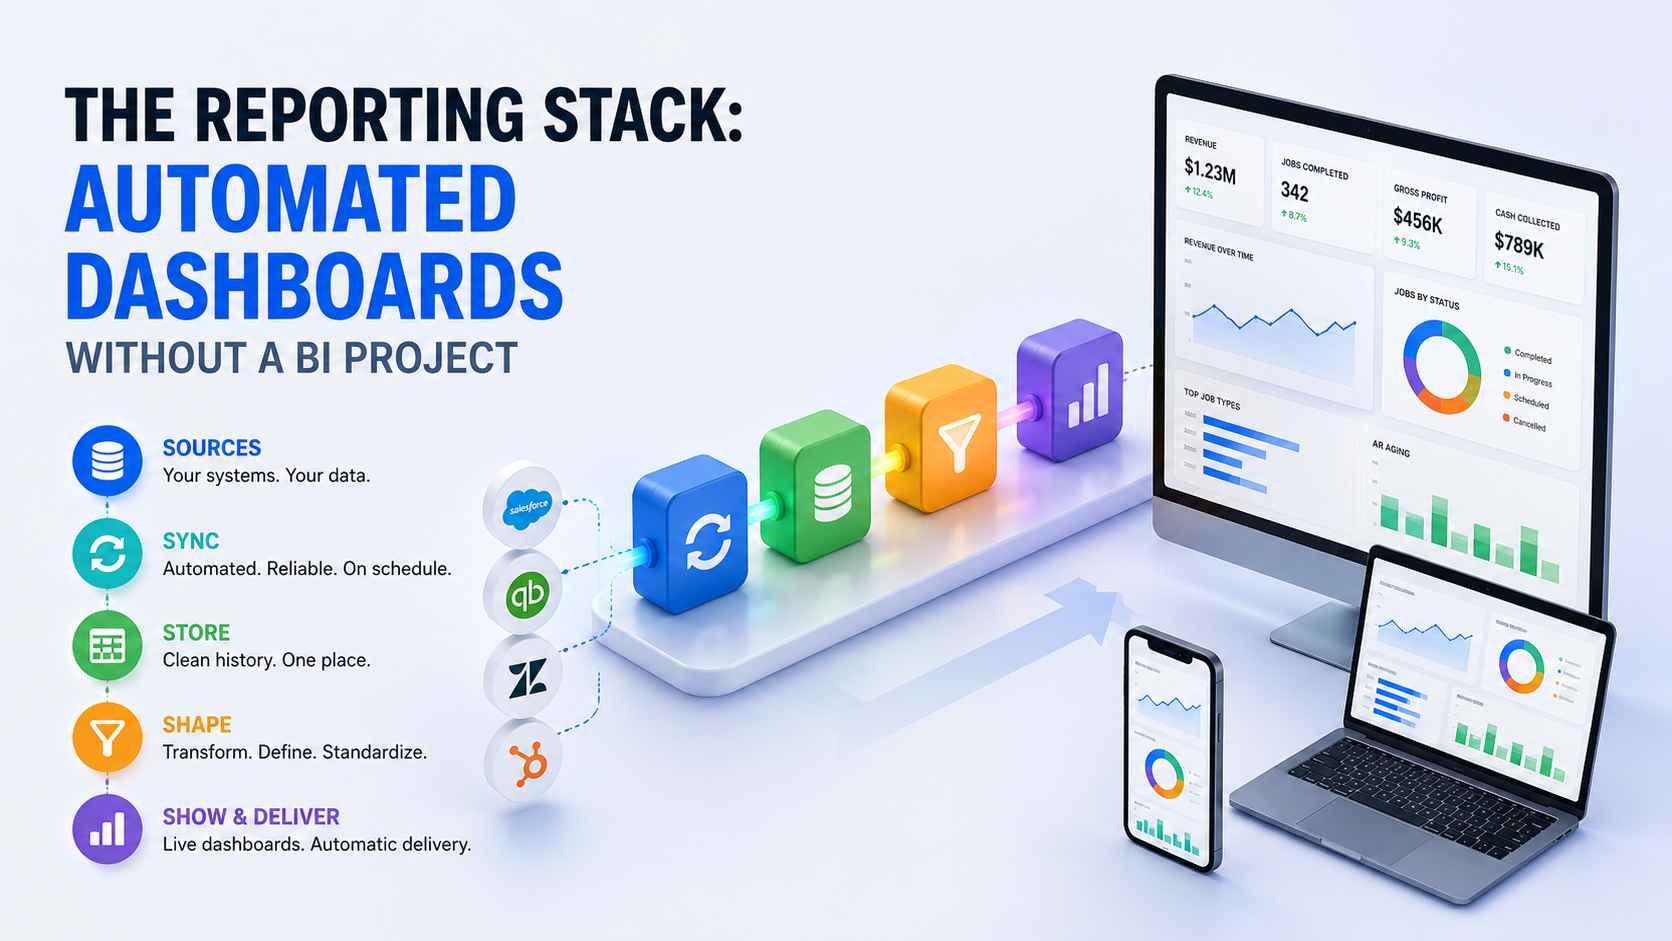
It is 3 p.m. on Friday. Someone your payroll values highly is exporting three CSVs, fixing the same date column as last week, and pasting numbers into a deck nobody will challenge because nobody can check it. The report ships Monday at nine. By Monday at ten, it is history. Next Friday, the ritual repeats. It has repeated for two years.
We build operations infrastructure with engineering discipline for $10M-$50M operators, and this scene shows up in almost every discovery we run. Here is the uncomfortable reframe, and then the way out.
The report you assemble is the dashboard you never built
Every recurring report is a dashboard prototype running on human labor. Same numbers. Same layout. Same sources. The only difference: a dashboard fetches the numbers itself, and the report makes a person do it, weekly, forever.
So the question is never "should we have dashboards." You already do. You are rendering them by hand. The question is what it takes to make the machine do the rendering, and the answer is much smaller than the industry wants you to believe.
Price the ritual first. Four hours a week is two hundred hours a year. Per report. Most operators run three or four rituals. The stack costs less than one year of one of them.
The industry's answer is a BI project. Yours can be a reporting stack. The difference funds the rest of this post.
What a BI project is, and why you were told you need one
A business intelligence project builds a data platform: a warehouse, extraction pipelines, transformation models, a semantic layer, governance, and the analysts to run it. Enterprises need this. Their data spans dozens of systems, millions of rows, and years of modeling questions.
You were told you need one because the people telling you sell one. Warehouse vendors, BI platforms, and data consultancies all scope the same first step: the platform. Quarters of work before the first chart, and a new team to keep it alive.
A $10M-$50M operator asking "how did we do last week and what needs attention" does not have a platform problem. A BI project models the whole business. A reporting stack answers Monday's questions. Buy the second.
Graduate to the first only when the triggers at the end of this post arrive. Ask around your network first, too. Half the warehouse projects you hear about stalled somewhere between the pipeline and the payoff.
The five-layer reporting stack
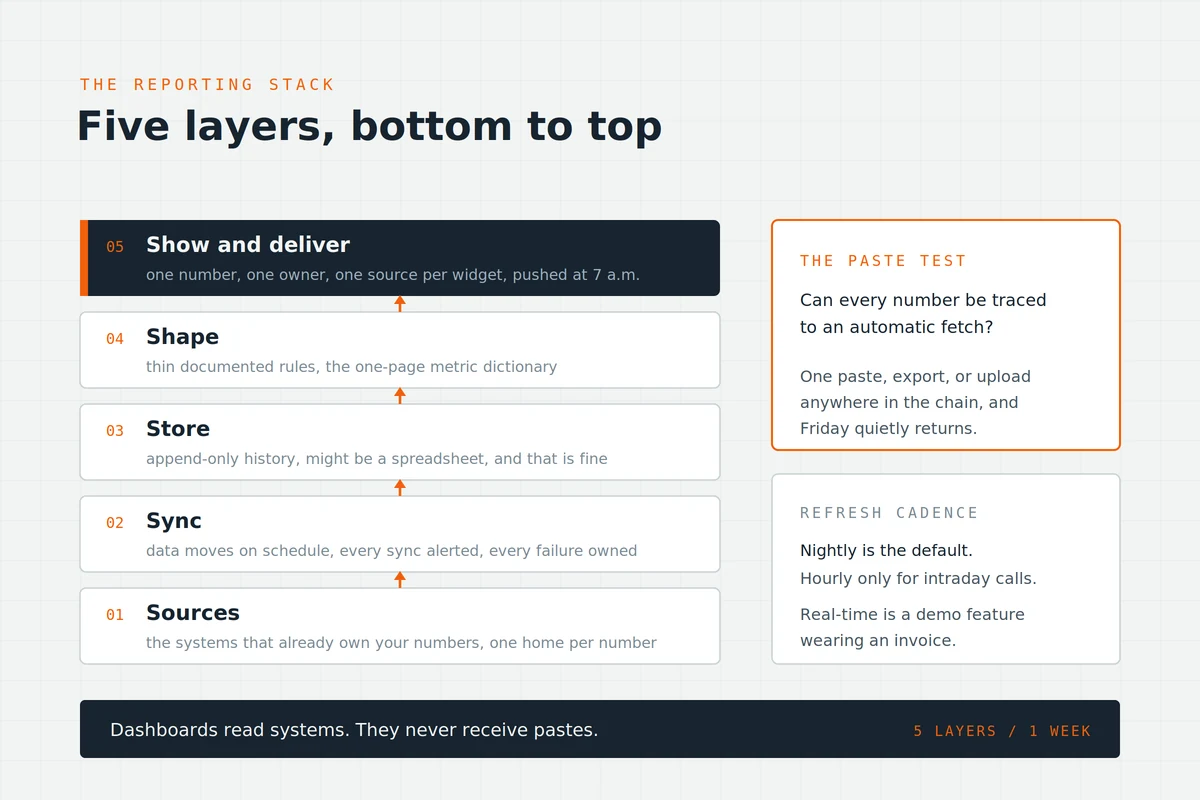
The stack is small enough to draw on a napkin and honest enough to run a company on. Five layers, bottom to top.
Layer one: sources
The systems that already own your numbers. The CRM owns pipeline. The job platform owns operations. The books own money. The enrichment guide established the rule that applies here: one system of record per object, and every number has exactly one home.
If a number has two homes, stop building and fix that first. Dashboards amplify whatever truth or confusion the sources hold.
Freeze the source list once chosen. New tools join the stack through the front door: a sync, a store column, a dictionary entry. Side doors breed the two-homes problem all over again.
Layer two: sync
The connective layer that moves data on schedule without a human in the loop. Native connectors where they exist. Middleware where they do not. This is integration builds territory. The engineering standards travel with it: every sync alerted, every failure owned. A dashboard fed by a silently dead sync is a confident liar.
Nightly is the default cadence. It serves a Monday view perfectly. Hourly earns its cost only where operations decisions run intraday. Real-time is a demo feature wearing an invoice.
The paste test
One test certifies this layer. Can any number on the dashboard be traced to an automatic fetch? If a paste, an export, or a manual upload sits anywhere in the chain, the layer fails, and Friday quietly returns.
Layer three: the store
Where synced data lands and history accumulates. Here is the sentence BI orthodoxy hates: your store might be a spreadsheet or a lightweight database, and at operator scale, that is fine.
A governed sheet holding daily snapshots serves a fifty-person company honestly. A small hosted database serves the next size up. The warehouse is a graduation, not a prerequisite. What matters at every scale: the store is append-only for history, one tab or table per source, and nobody edits it by hand.
Snapshots are the store's quiet superpower. Source systems show today. The store remembers every day. Trend lines come from that memory, and no live connection can draw them without it.
Layer four: shape
The thin rules that turn raw rows into reportable numbers. Week boundaries defined. Revenue categories mapped. Job types grouped. The formulas live in one documented place, not inside seventeen chart configs.
The one-page metric dictionary
Write every metric down once: name, source, formula, owner. One page. This is the semantic layer's whole job at operator scale, done in an afternoon, and it ends every "which number is right" meeting permanently.
One entry shows the shape. Weekly revenue invoiced: from the books, sum of invoices dated in the ISO week, owned by finance. Twelve words. Argument over.
Layer five: show and deliver
The dashboard itself, plus the push. Free and lightweight viewers cover operator needs: connect the store, place the widgets, share the link. Delivery matters as much as display. The Monday view lands in chat at 7 a.m. by itself. Pull for the curious, push for everyone else.
One rule governs every widget: one number, one owner, one source. A widget nobody owns becomes decoration within a quarter. And the view fits a phone, because half its Monday opens happen before anyone reaches a desk.
The exhaust principle
Our operations definition put it this way: reporting is the exhaust of the spine, not a separate project. The stack above only works because the spine below emits clean data as a side effect of running.
The principle cuts both directions. When every job, quote, and invoice moves through automated workflows, the dashboard assembles itself from their trail. And when a dashboard needs manual assembly, it is diagnosing a spine gap for you. The missing paste is the missing integration. Fix the spine link, and the report becomes exhaust again.
This is why we build reporting as part of operations work rather than as an analytics project. The dashboard is the spine's scoreboard. The scheduling metrics and quote metrics from our other builds land on it automatically, because the systems generating them were built to emit.
One example closes the loop. A quote ships, and its timestamp joins the store that night. Nobody reported it. The system confessed it. Exhaust, collected.
The first dashboard in one week
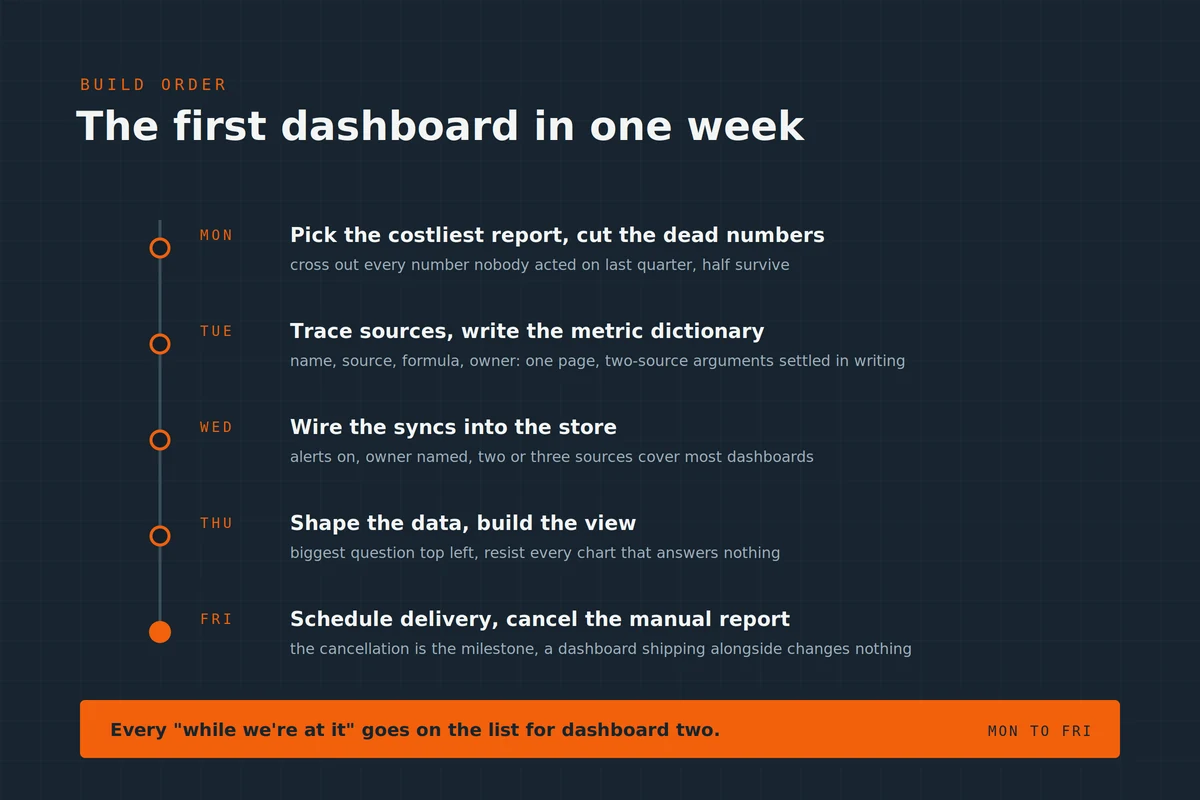
No phases, no committee. A working build order.
Monday: pick the one report that costs the most Friday hours, and list its numbers. Cross out every number nobody acted on in the last quarter. Usually half survive.
Tuesday: trace each surviving number to its source system, and write the one-page metric dictionary. Any number with two sources gets its argument settled today, in writing.
Wednesday: wire the syncs for the top sources into the store. Alerts on, owner named. Two or three sources cover most operator dashboards.
Thursday: shape the data and build the view. Place the widgets by the questions they answer, biggest question top left. Resist every chart that answers nothing.
Friday: schedule the delivery, send the link, and cancel the manual report with a short note about where the numbers now live. The cancellation is the milestone. A dashboard that ships alongside the old report changes nothing.
Thirty days of parallel trust-building follow, and then the stack simply is how numbers work.
One guard keeps the week a week. Every "while we're at it" request goes on a list for the second dashboard. Scope creep is how one-week builds become quarter-long projects wearing the same name.
The three dashboards an operator actually needs
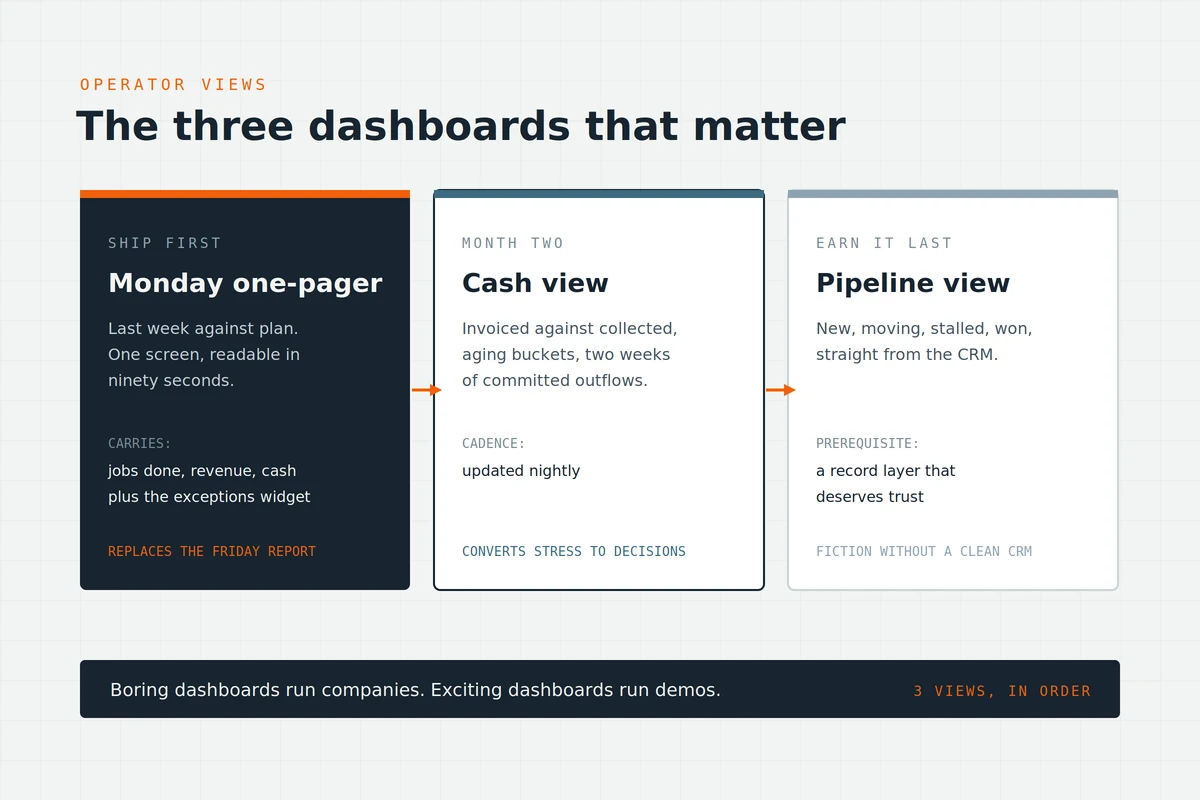
Opinion, earned across seven industries: most operators need three views, and the third is optional.
The Monday one-pager. Last week against plan: jobs or orders completed, revenue invoiced, cash collected, and the two or three exceptions needing attention. One screen.
Readable in ninety seconds. This one replaces the Friday report and earns the whole stack. The exceptions widget does the heavy lifting: stalled jobs, overdue invoices past a threshold, syncs that failed. Numbers inform. Exceptions instruct.
The cash view. Invoiced against collected, aging buckets, and the next two weeks of committed outflows. Updated nightly. Most operator stress is cash timing, and a live view converts stress into decisions.
The pipeline view. New, moving, stalled, and won, straight from the CRM. Only build it after the record layer deserves trust, because a pipeline dashboard on a neglected CRM is fiction with charts.
Notice what is absent: vanity metrics, real-time tickers, and anything requiring a data scientist. Boring dashboards run companies. Exciting dashboards run demos.
The order matters too. Ship the one-pager first. Add cash in month two. Earn the pipeline view last. Each dashboard proves the stack before the next one spends it.
When you genuinely need the BI project
Fair witness, because the graduation is real for some readers.
Row counts that break spreadsheets and small databases. Analysts asking modeling questions across years of history. Multiple entities consolidating with currency and hierarchy logic. Regulatory reporting with lineage requirements. Data science ambitions with actual staffing behind them.
Two or more of those, and the warehouse conversation is honest. The stack you built first still pays: your sources are known, your metrics are defined, and your syncs already run.
A reporting stack is the best possible discovery phase for a BI project you might never need. Nothing gets thrown away. The dictionary becomes the semantic spec. The store becomes the staging sample. The week you spent becomes the quarter you saved.
How ACS ships reporting stacks
This is our most compact engagement: small scope, fast ship, visible daily. Fixed fee after a paid, refundable discovery that inventories your recurring reports, prices the Friday hours, and writes the metric dictionary draft with you in the room. The first dashboard ships inside two weeks, because the layers are light on purpose.
The build follows the week above, with the engineering constants attached: syncs alerted and owned, the store governed, documentation and training in scope, accounts in your name. The wider spine practice sits on the operations automation page, the engagement structure on pricing, and the record in the case studies: 500+ workflows shipped, more than 10,000 hours reclaimed, over $2 million in client savings.
Frequently asked questions
Is Power BI outdated?
No, and the question misdiagnoses the problem. Enterprise BI platforms remain excellent at enterprise BI. The mismatch is scale: operator reporting needs five light layers, not a platform. Judge tools against your stack layer, not against each other's marketing.
Which tool automatically combines data from different sources?
A category, not a single tool. Middleware and native connectors move the data. A store holds it. A viewer displays it. The combining is the sync layer's job. Any stack with those layers combines sources. The alerting on the syncs matters more than the logo on the viewer.
What is an automated reporting system?
A pipeline where numbers travel from source systems to a delivered view without human hands: sync on schedule, store with history, shape by documented rules, show and push. The paste test certifies it. One manual step anywhere, and it is a report with extra steps.
Do we need a data warehouse for dashboards?
Not at operator scale. A governed spreadsheet or lightweight database stores daily snapshots honestly for most $10M-$50M companies. The warehouse graduation triggers are volume, modeling depth, multi-entity consolidation, and compliance lineage. Until then, lighter is truer.
Can AI generate our reports?
AI drafts commentary well: summarizing the week's numbers into three readable sentences. The numbers themselves come from the stack, never from a model's memory. Same division as everywhere in our practice: rules produce figures, AI produces language, humans keep judgment. A model narrating verified numbers saves an hour. A model inventing numbers costs a quarter of trust.
What about Python for automated report generation?
A legitimate route when an engineer owns it: scripts fetching, shaping, and rendering on schedule. The five layers still apply, code just implements them. Choose it for custom logic and volume. Skip it when nobody on staff will maintain the scripts.
Are free dashboard tools good enough?
At operator scale, usually yes. Free viewers tied to major ecosystems handle connection, charts, and sharing well. The value lives in your sync reliability and metric definitions, not the viewer's price tag. Spend the effort where the truth is made.
How often should automated dashboards update?
Match the decision cadence. Nightly refresh serves weekly reviews perfectly. Hourly serves intraday operations views. Real-time serves almost nobody outside monitoring. Faster refresh costs sync load and attention. The Monday one-pager on a nightly refresh answers most operator questions honestly.
How do we keep dashboards from being ignored?
Give every widget an owner. Deliver on schedule to where people already look. Review the view itself quarterly. Delete charts nobody references. A dashboard earns attention by being current, small, and acted on. Decoration gets scrolled past. The Monday meeting reading it aloud for the first month builds the habit fastest.
Still assembling Friday's report by hand?
Three ways forward.
Book a paid discovery. Report inventory, Friday hours priced, metric dictionary drafted, one fixed price. Refundable if the fit is wrong. Details on pricing.
Fix the spine first if the pastes run deep. The operations automation practice closes the gaps dashboards keep exposing, one link at a time.
See the emitted numbers. The case studies show systems built to report themselves, across seven industries.
Five layers. One week of building. Friday gets its afternoon back, and Monday finally knows the score.